What the 2026 Kelvin Wave Means for El Niño and U.S. Coasts
The 2026 Kelvin wave is an ocean mechanism, not a local flood forecast. Here is how it connects to El Niño and how to read NOAA’s U.S. coastal outlook.
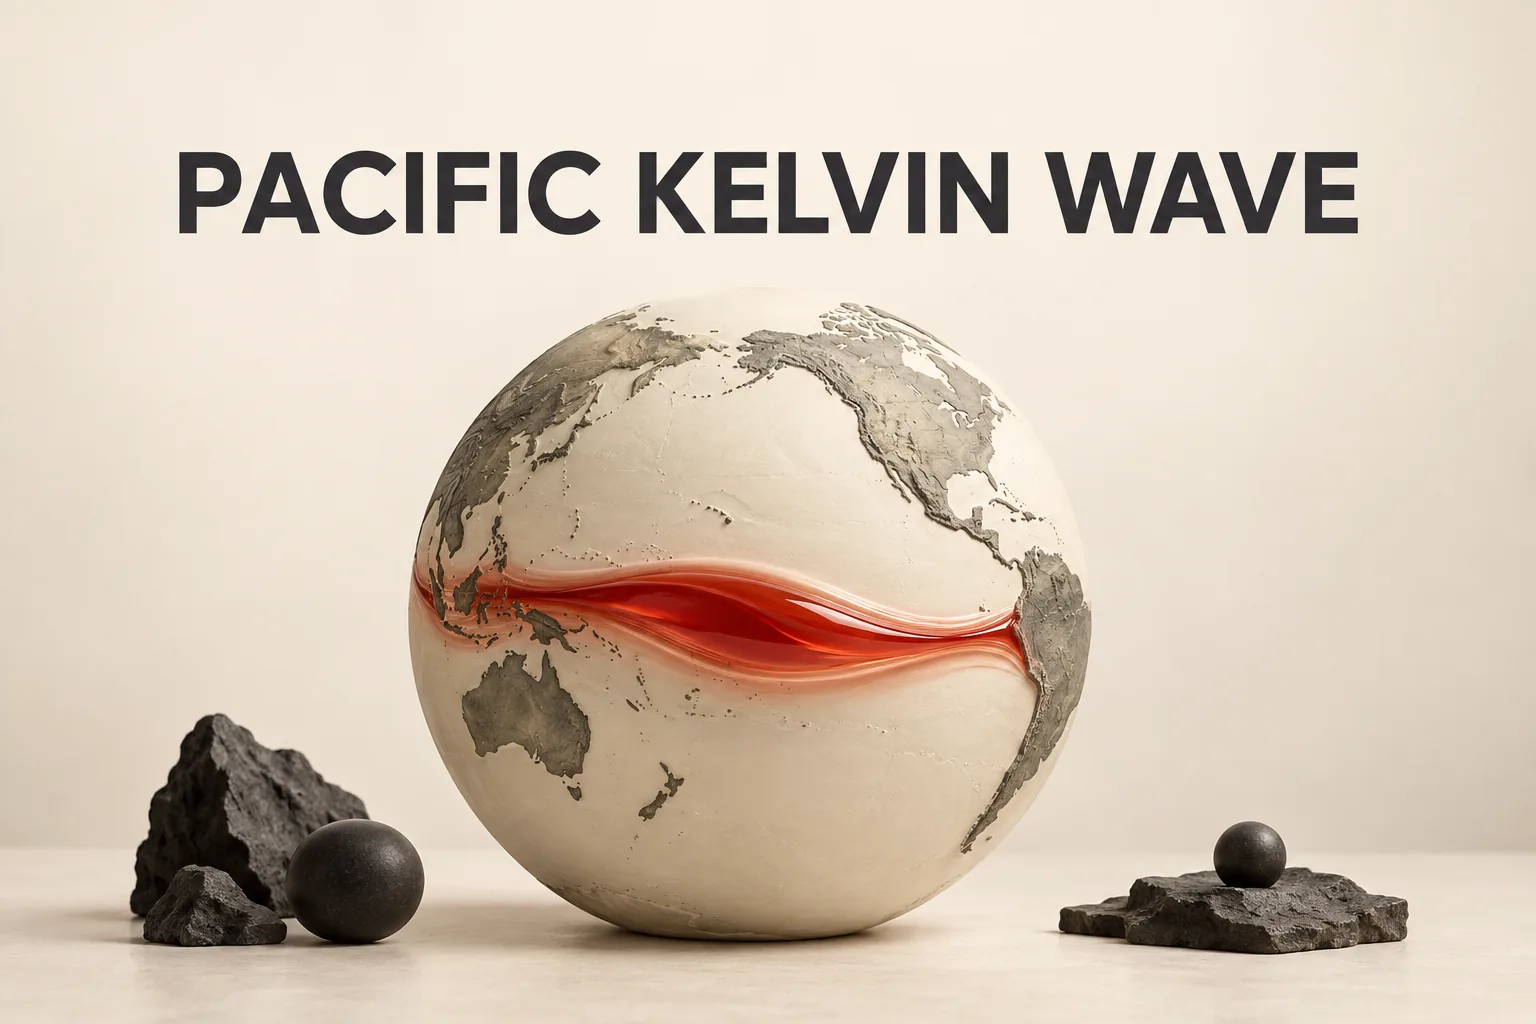
“Kelvin wave 2026” is shorthand for an ocean process in the tropical Pacific that helped set the stage for the developing 2026–27 El Niño. It does not describe one giant surface wave moving toward every coast.
Evidence cutoff: September 28, 2026, 2:38 p.m. EDT.
The useful answer has two parts: the Kelvin wave is the mechanism that moves subsurface heat eastward, while El Niño is the larger ocean–atmosphere pattern that can follow. By the cutoff, NOAA was describing a strengthening El Niño, not merely a possible wave on the horizon.
A Kelvin wave is the mechanism, not the whole climate event
When trade winds weaken or reverse across the tropical Pacific, warm water that has accumulated in the western Pacific can move eastward as a downwelling oceanic Kelvin wave. The warm water pushes the thermocline—the boundary between warmer surface water and colder deep water—downward. That makes it harder for cold deep water to reach the surface and can raise surface temperatures in the central and eastern Pacific.
NOAA also describes a second part of the process: after the warm upper-ocean signal reaches the Americas, it can move poleward along the coast and raise regional sea-surface height. This is why the same term can appear in discussions of both tropical climate and U.S. coastal flooding.
A useful translation is:
- Equatorial Kelvin wave: an eastward-moving pulse of subsurface warm water.
- Coastal response: a related sea-level and upper-ocean signal that can travel along the Pacific coasts of the Americas.
- El Niño: the broader ocean–atmosphere pattern NOAA is diagnosing when ocean warming and atmospheric changes reinforce one another.
The distinction matters. A Kelvin wave helps explain why conditions are changing, but the term alone is not a forecast for a particular beach, tide gauge, or neighborhood.
What was actually observed during 2026?
NASA’s May 27 report on the Sentinel-6 Michael Freilich mission described a small Kelvin wave that formed near Micronesia in late January and dissipated by mid-February. A second wave emerged in early March and traveled eastward. By mid-May, sea levels near Peru were more than 15 centimeters, or about 5.9 inches, above their long-term averages.
That sea-level measurement was not a measurement of a breaking wave. NASA explained that warmer water expands, so an elevated sea surface can reveal the presence of additional heat below the surface. In this case, the satellite observation supplied an early physical clue that the tropical Pacific was accumulating the heat associated with El Niño development.
NOAA’s September 10 ENSO Diagnostic Discussion described the later state of the system: eastern equatorial Pacific sea-surface-temperature anomalies above +3.0°C, a deeper-than-average thermocline, very warm subsurface water, and westerly wind anomalies across parts of the equatorial Pacific. The discussion did not present the situation as a newly arriving isolated Kelvin wave. Instead, it assessed the coupled ocean–atmosphere pattern that earlier subsurface warming helped produce.
That is the key change over the course of the year. In spring, the important question was whether eastward-moving ocean heat could help initiate El Niño. By September, NOAA was evaluating how strongly the ocean and atmosphere were reinforcing the established pattern.
How strong was the 2026–27 signal at the cutoff?
NOAA’s September 2026 ENSO strength archive gave a 97% probability of a very strong El Niño for September–November 2026, 98% for October–December, and 93% for November–January. NOAA defines “very strong” as a three-month relative Oceanic Niño Index, or RONI, of at least +2.0°C.
NOAA’s September diagnostic also gave a 75% chance that the October–December RONI would reach at least +2.5°C, a level it described as historic compared with events in the post-1950 record.
These numbers describe seasonal climate indicators, not daily conditions at the coast. They answer a question about the likely strength of the large-scale El Niño pattern. They do not mean that every coastal community will experience flooding, or that flooding will occur on a particular date.
What does the signal mean for U.S. coasts?
The direct ocean connection is clearest along the Pacific Coast. NOAA explains that warm water associated with El Niño can move eastward and then poleward along the coast, temporarily raising coastal water levels and increasing the chance that high tides, waves, or storms reach flood thresholds.
That temporary signal is added to the existing background of long-term relative sea-level rise. The practical risk comes from the combination: a higher baseline leaves less room before an ordinary high tide or storm-driven water level reaches roads, shorelines, or other low-lying areas. Local tides, winds, waves, storms, rainfall, and land motion still determine what happens at a specific location.
The Mid-Atlantic has a different connection. NOAA describes El Niño-related changes in atmospheric circulation, onshore winds, and coastal storms as factors that can compound high-tide flooding there. That is not the same pathway as a Kelvin wave arriving directly at the coast, even though both effects can occur during the same El Niño season.
NOAA’s broader annual high-tide-flooding outlook covers the meteorological year from May 2026 through April 2027, rather than the calendar year. It projects a national median of 7–12 high-tide-flooding days, 15–20 days across the Mid-Atlantic, and 7–18 days across the Pacific Northwest. Those figures are regional, probabilistic outlooks that include long-term sea-level conditions and other local drivers; they are not a count of floods caused by the Kelvin wave alone.
How to read future Kelvin-wave claims
Start by identifying which layer a claim describes. “A Kelvin wave is moving east” is an ocean-process statement. “El Niño is very strong” is a seasonal climate assessment. “A location may flood during a particular high tide” is a local-impact question. Treating those as interchangeable is how a useful scientific signal becomes an exaggerated headline.
Next, match the time scale. NOAA’s annual outlook spans May 2026 through April 2027, while a local flooding decision depends on the tide, weather, waves, and coastal conditions on a specific date. A seasonal probability cannot substitute for a local forecast.
For a location-specific question, NOAA points readers toward its Coastal Inundation Dashboard, monthly high-tide-flooding outlooks, and local tide-gauge data. Those tools are more appropriate than using the phrase “Kelvin wave 2026” as a direct prediction. The wave explains why the seasonal background may be different; local observations determine whether that changed background overlaps with a high-impact tide or storm.
The most accurate bottom line is therefore narrower than “a huge wave is coming.” NASA observed eastward-moving warm-water signals in 2026, and NOAA now describes a strong El Niño pattern with elevated seasonal coastal-flooding concerns in some U.S. regions. The Kelvin wave is the physical link between those developments—not a stand-alone forecast for every American shoreline.
Sources
- NOAA Climate Prediction Center: ENSO Diagnostic Discussion
- NOAA Climate Prediction Center: Official ENSO Strength Probabilities, September 2026
- NOAA Ocean Service: El Niño and high tide flooding, a possible double whammy for some coastal communities in 2026
- NOAA Tides & Currents: Annual High Tide Flooding Outlook
- NASA: NASA-European Sea Level Mission Homes in on El Niño
Related notes
- What El Niño 2026 Means for California—and What It Doesn’t
- What El Niño 2026 Means for California: A Wetter Winter Is More Likely, Not Guaranteed
- What Does El Niño Mean for the U.S. in Fall and Winter 2026–27?
- El Niño 2026: What NOAA’s U.S. Outlook Actually Says
- What El Niño 2026 Means for the U.S.—and What It Does Not Tell You